
Contact centers are crucial to building and maintaining a loyal customer base. They ensure consumer satisfaction and retention by providing omnichannel, personalized support. Deploying contact center as a service (CCaaS) helps businesses streamline customer service delivery.
However, businesses must identify whether their hired contact centers perform well. They need to guarantee returns while ensuring customers receive quick and effective answers.
So how do you tell if a contact center adds value to your business?
Key performance indicators (KPIs) measure your customer service team’s productivity and performance. Let’s start by detailing each metric and understanding why KPIs matter.
What Are Contact Center Metrics?
Companies measure the effectiveness of their customer service units using contact center metrics. These KPIs provide statistical evidence of customer satisfaction, agent performance, and operational efficiency. The resulting data helps establish measurable goals and determine areas of improvement.
Contact centers are the go-to hub of consumers when they encounter product issues. As digitization expands, customer demand for personalization also increases. According to a Salesforce report, 73% of 13,000 polled consumers assume companies understand their unique needs.
Contact centers thus optimize CCaaS to meet that demand. Their cloud-based software helps agents accelerate responses to customer issues using those customers’ preferred communication channels. It streamlines customer service by integrating the following platforms:
- Voice calls enable consumers to talk to agents via telephones or mobile devices.
- Email facilitates the transmission and receipt of long-form electronic messages.
- Live chat allows real-time interactions between customers and agents over a network.
- Text messaging lets customers send short digital messages even without the internet.
- Video calls apply audio and visual technologies for live customer engagement.
- Social media unifies audio, video, and chat for more personalized communications.
In the study, Salesforce mentions that the abundance of personal insights from daily interactions drives the customer expectation that companies recognize their preferences. They anticipate that companies will use such data to personalize customer service.
Key Contact Center Metrics for Customer Experience
Making customers happy and satisfied is the top priority of every company. Business reputation and credibility rely on customer ratings and comments on products. Positive feedback encourages existing and potential consumers to stay loyal to the brand.
But how do you ensure you’re meeting customer needs? Consider the following KPIs to determine whether you deliver a superb customer experience:
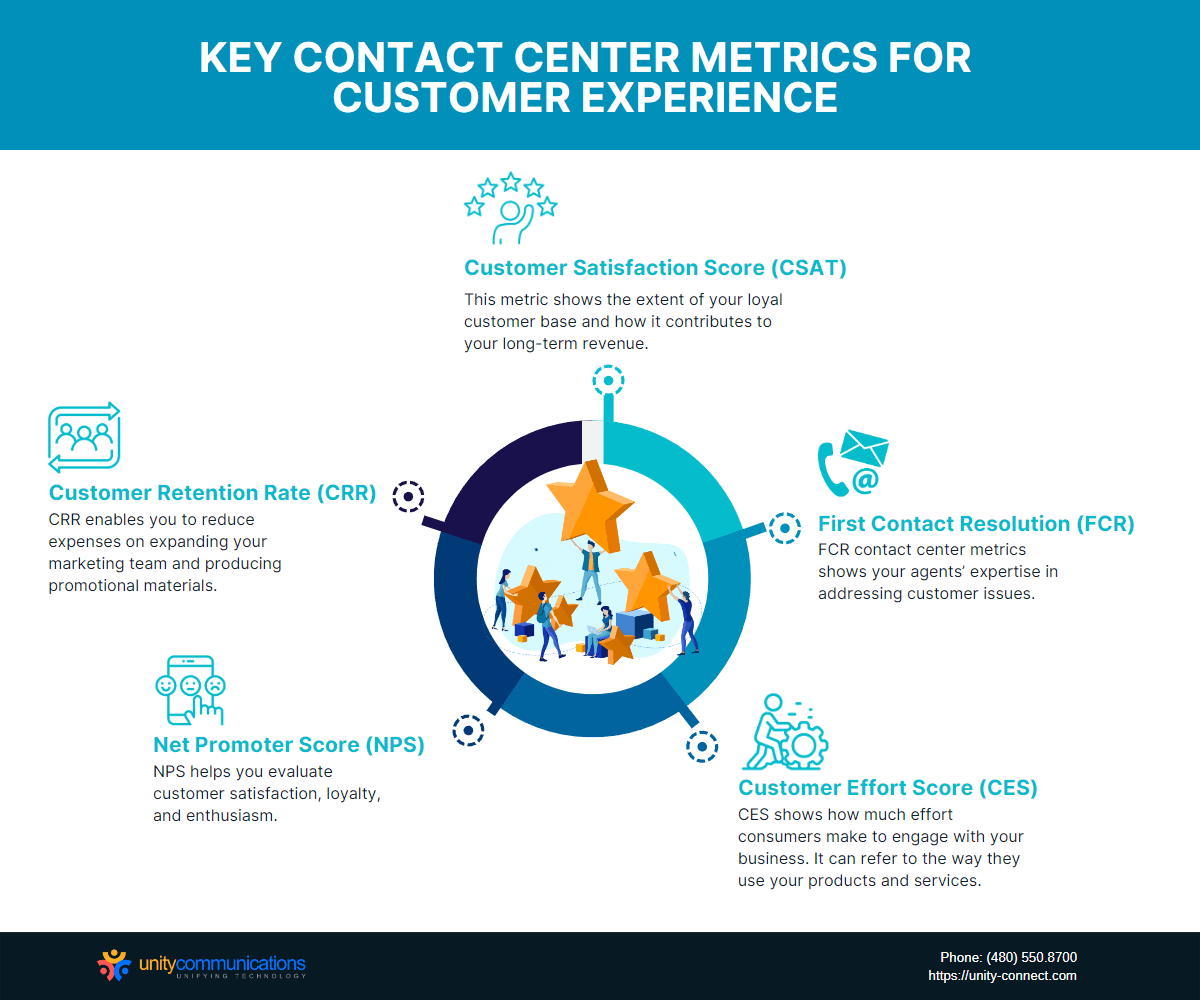
1. Customer Satisfaction Score (CSAT)
CSAT reflects customers’ contentment with company products and support services. It’s one of the most commonly used KPIs to identify which aspects of customer service need revamping. This metric also shows the extent of your loyal customer base and how it contributes to your long-term revenue.
Companies usually conduct customer surveys after each transaction to obtain CSAT scores. The data helps determine if consumers are getting adequate assistance, regardless of the channel used. Depending on your scoring system, you can ask open-ended questions and categorize survey responses based on feelings such as:
- Very satisfied
- Satisfied
- Neutral
- Not satisfied
- Very Unsatisfied
If you want quantitative results for graphical representations, use a Likert scale to collect and measure respondents’ attitudes and opinions. Customers can rate their experience from one to five or one to 10. Number one can either mean extremely satisfactory or very unsatisfactory.
The results help you better understand your contact center’s efficiency. Such data also lets you know whether a CCaaS platform contributes to your customer satisfaction rating.
2. First Contact Resolution (FCR)
FCR refers to how often an agent resolves customer issues without callbacks. Most consumers want to have their problems solved during the first contact to avoid the hassle of following up.
FCR is one of the most precise contact center metrics to show your agents’ expertise in addressing customer issues. It also indicates the effectiveness of your standard operating procedures and customer service strategies.
To calculate this KPI, divide the number of inquiries completed within the first interaction by the total number of calls or messages received. The result shows how high the FCR is.
A low FCR implies a possible deficit in your customer service processes. It gives you hints about which aspects you need to prioritize and improve. Those areas might include training schedules, infrastructure conditions, and customer support procedures.
3. Customer Effort Score (CES)
CES shows how much effort consumers make to engage with your business. It can refer to the way they use your products and services. It can also point to how easy it is for them to get customer support and resolve purchase issues.
Most of the time, assessing the ease of the customer experience gives a better perspective on brand loyalty than simply calculating CSAT scores. Zendesk’s report reveals that 90% of consumers will spend more with companies offering personalized customer service. However, they will switch brands if they don’t receive quick and convenient support.
So instead of seeking customer satisfaction rates, ask your consumers to gauge how trouble-free their service experience was. You can measure CES through a Likert-scale survey of simple customer experience questions. Launch this survey during the following scenarios:
- Immediately after closing a deal that resulted in a purchase or subscription
- Immediately after they have concluded customer service,
- When supporting product development and testing
4. Net Promoter Score (NPS)
NPS helps you evaluate customer satisfaction, loyalty, and enthusiasm. This contact center metric lets you know your consumers’ willingness to suggest your products and services to others.
This KPI depends on a survey asking a single question: “On a scale of zero to 10, how likely are you to recommend our products or services to others?”
When calculating NPS, break down all respondents into three categories:
- Promoters are loyal customers who spread positive product and service reviews.
- Detractors are unhappy consumers who leave negative company ratings and reviews.
- Passive buyers are satisfied but unenthusiastic buyers who might switch to competitors.
Calculate NPS by subtracting the percentage of detractors from promoters. A score of more than 50 is acceptable. To simplify scoring, you can classify your sliding scale like this:
- Nine and ten as promoters
- Seven to eight as passive
- Zero to six as detractors
Final scores provide insights into which parts of your products or customer service make your consumers less satisfied. You can then develop new strategies or enhance your offerings to transform customers into promoters.
5. Customer Retention Rate (CRR)
Retaining your existing buyers is cheaper than trying to win new ones. It enables you to reduce expenses on expanding your marketing team and producing promotional materials. Loyal customers support your company’s growth by giving positive product reviews, providing recommendations, and promoting your brand via social media.
So tracking your CRR is vital. This contact center metric measures the number of customers who constantly engage with your business during a given period. It helps quantify your customer service program’s efficacy. You can also understand lifetime consumer value by executing the following steps for calculating CRR:
- Specify the time frame you want to study (e.g., daily, monthly, quarterly, or yearly).
- Collect the number of existing customers at the beginning of the period.
- Determine the number of total customers at the end of the period.
- Identify the number of new buyers added within the period.
- Subtract the number of new clients from the ones recorded in the past.
- Divide the difference by the initial number of customers.
- Multiply the quotient by 100 to get CRR.
Key Contact Center Metrics for Agent Productivity
Contact center agents are critical in gaining and building customer trust. Therefore, you must track how quickly and efficiently your customer service division completes its tasks.
Setting metrics allows you to identify your team’s weak spots and address them. Here is a list of KPIs to help monitor your agents’ performance and productivity.
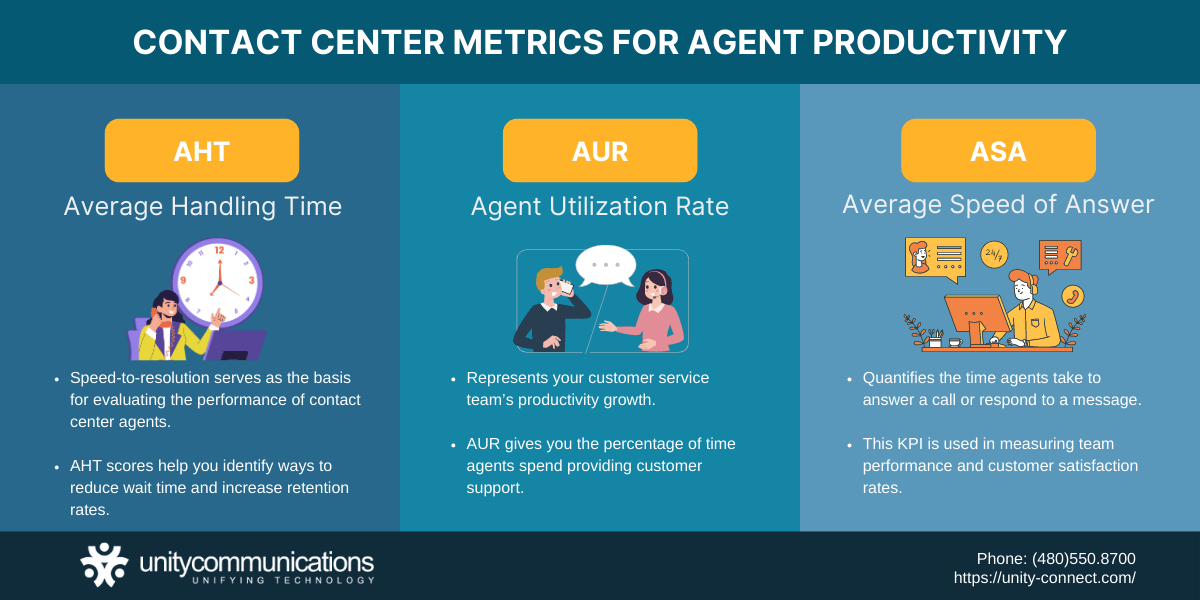
1. Average Handling Time (AHT)
AHT lets you know how long an agent takes to complete a single customer interaction. The metric measures engagement from the moment a customer connects with an agent until the end of their conversation. It includes talk time, hold duration, and after-contact work.
Speed-to-resolution serves as the basis for evaluating the performance of contact center agents. This factor resembles how effectively they address customer concerns and complaints. AHT scores help you identify ways to reduce wait times and increase retention rates.
2. Agent Utilization Rate (AUR)
Among the contact center metrics, AUR best represents your customer service team’s productivity growth. The KPI gives you the percentage of time agents spend providing customer support. You can use the results to help streamline task scheduling and address staffing issues.
Calculate the AUR by following the steps below.
- Record the amount of time it takes for agents to perform their customer service duties.
- Divide the engagement time by their actual clock time.
- Multiply the corresponding amount by 100.
- Get the proportion of agent consumption.
Aside from determining how efficient your agents are in fulfilling their duties, this metric also helps you identify the factors leading to burnout and overwork. It informs your efforts to resolve such issues and avoid poor performance. You can also use the rating to develop innovative and practical projects and achieve work-life balance.
3. Average Speed of Answer (ASA)
ASA quantifies the time agents take to answer a call or respond to a message. It is one of the most influential KPIs when measuring team performance and customer satisfaction rates.
Customers value their time. Emplifi reported that 10% of polled American consumers want a full-packed agent response within five minutes. The software provider added that slow response time was the primary contributor to a negative experience.
Ultimately, the risk of customer dissatisfaction increases as customer wait times extend. If you can’t maintain your target ASA, it shows staffing levels, training, and task distribution gaps. Hence, you must focus on developing strategies to address such issues.
Key Contact Center Metrics for Operations
Tracking the efficiency of your contact center is also critical. Operational KPIs provide important data showing patterns of peak hours, trends, and staffing needs.
These metrics also help you understand the impact of your core projects (e.g., product launches and marketing campaigns) on contact volumes. Explore the different KPIs to assess your enterprise-wide contact center performance below.
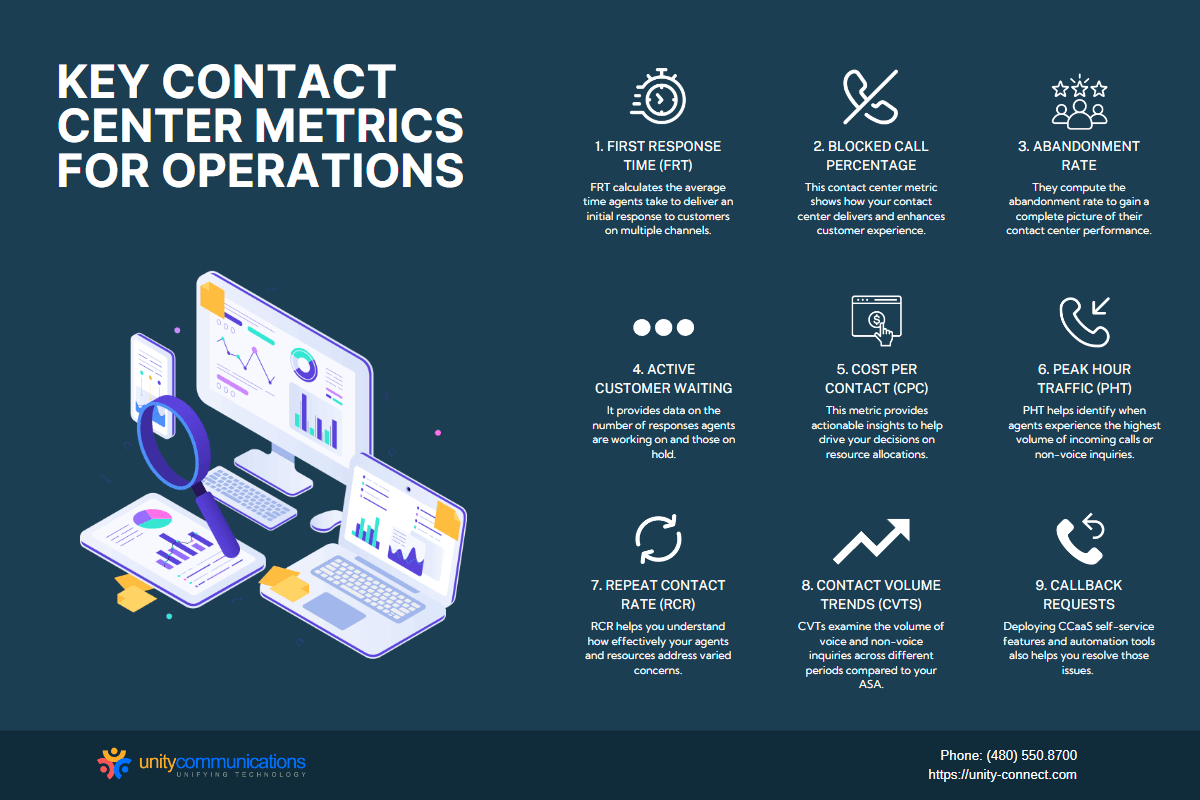
1. First Response Time (FRT)
FRT calculates the average time agents take to deliver an initial response to customers on multiple channels. This metric is commonly associated with CSAT scores. Faster response time means your team is well-prepared to provide customer support, which helps prevent consumers from being frustrated and switching brands.
You can compute your average FRT by calculating the sum of all first response times and dividing it by the number of completed tickets. It’s typically quoted in minutes, hours, and days. However, you must not include automated responses such as those from virtual assistants and chatbots.
Low FRT means more customers feel content with your service. Satisfied consumers stick to your brand and even help you promote your offerings by leaving positive feedback and recommending them to others. This helps increase your sales and profits.
2. Blocked Call Percentage
Blocked calls occur when customers reach a busy signal while attempting to seek product support. A busy tone usually means a lack of available agents or your contact center software can’t handle the volume of incoming calls. Such an issue results in poor customer experience, frustration, and dissatisfaction.
Hence, you must determine the percentage of these blocked calls. This contact center metric shows how your contact center delivers and enhances the customer experience. It also clarifies which aspects of your customer service require further improvement.
3. Abandonment Rate
Businesses also look at the number of voice and non-voice inquiries customers abandon before getting a response. They compute the abandonment rate to fully understand their contact center performance.
If the percentage of abandoned queries is high, it indicates possible significant problems in your contact center. Long wait times and inefficient customer support agents are some examples of issues contributing to your high abandonment rate. Offering self-service options like chatbots and automated phone systems through your CCaaS platform can help lower the rating.
4. Active Customer Waiting
The active customer waiting metric lets you understand how your customer service teams handle the volume of inquiries in real time. It provides data on the number of responses agents are working on and those on hold. Many calls or messages on hold lead to lower customer retention and a negative consumer experience.
5. Cost per Contact (CPC)
CPC refers to the overall operating expenses of your contact center. To calculate the average CPC, add up the entire cost associated with handling queries from all channels, and then divide this sum by the total count of inquiries received. This measure offers valuable information that can guide decision-making regarding the distribution of resources.
Additionally, understanding your CPC can assist in identifying the most efficient and customer-preferred communication channels. With this knowledge, you can make informed decisions about where to focus your investments for enhancing customer satisfaction and loyalty.
6. Peak Hour Traffic (PHT)
PHT helps identify when agents experience the highest incoming calls or non-voice inquiries. This contact center metric sets out hourly patterns of overburden on resources. It allows you to prepare and develop concrete action plans for addressing workforce engagement and staffing needs.
7. Repeat Contact Rate (RCR)
RCR is a KPI intrinsically linked to First Contact Resolution (FCR). IT measures the frequency with which agents are unable to resolve issues during the initial contact. It also tracks the rate at which the same customer contacts your center again, either for the same issue or a different one. This metric is crucial for assessing the effectiveness of your agents and resources in handling a variety of concerns.
A high RCR indicates that your customer service team may be struggling with efficient problem resolution. In such cases, it is advisable to reevaluate and improve your workforce and infrastructure approaches. Providing regular, specific training to your agents or enhancing the self-service options of your Contact Center as a Service (CCaaS) can be effective strategies to address these challenges.
8. Contact Volume Trends (CVTs)
CVTs examine the volume of voice and non-voice inquiries across different periods compared to your ASA. This metric allows you to pinpoint specific times when incoming calls and chats begin to challenge agent bandwidth.
Apply this KPI when deciding on workforce scheduling and hiring. For instance, scheduling more agents to accommodate inquiries during hectic seasons can achieve a faster response time. This advantage results in improved CSAT scores.
9. Callback Requests
Tracking the frequency of callback requests can help you assess if you have the right staffing levels. If the rate of such requests is too high, it indicates staffing level insufficiencies. A lack of data can also mean you lack the bandwidth to receive inbound calls.
Focus on hiring more agents or enhancing customer service efficiency to reduce your callback requests. Deploying CCaaS self-service features and automation tools also helps you resolve those issues.
The Bottom Line

A contact center such as Unity Communications is the touchpoint of your business relationship with consumers. It helps you build and strengthen your customer base. Using cloud contact center software also allows you to deliver unmatched customer service.
But you need statistical evidence to measure the effectiveness of your customer support team. Understanding contact center metrics enables you to enhance workforce management and resource distribution. These significant actions help ensure customer satisfaction, improve productivity, and increase profitability.