Table of Contents
Establishing a contact center is the first step in exceeding customer expectations and providing excellent support. Next, you must know whether your customer service performs sufficiently or falters.
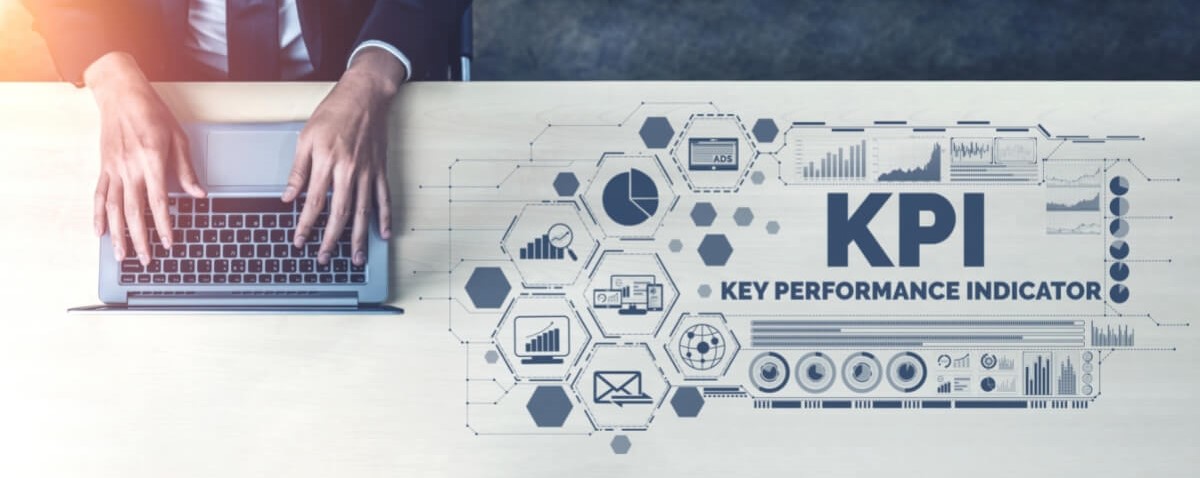
How do you ensure quality customer service? With contact center key performance indicators (KPIs), of course. Contact center metrics are an excellent way to assess your team’s performance.
This article gives you the top indicators to track for your contact center, even if you’re using a contact center as a service (CCaaS). We break down the KPIs and the reasons they matter.
Important Contact Center Key Performance Indicators To Track

Contact center KPIs are data points that monitor performance. Companies decide how often they review the metrics: weekly, monthly, quarterly, annually, etc.
You do not have to track all contact center metrics because it would be overwhelming. Instead, concentrate on the indicators you think are most important to your organization.
Below are the KPIs that show the difference between a good contact center and a great one.
1. Customer Satisfaction Score
The customer satisfaction (CSAT) score is one of the most effective KPIs because it helps you understand client experiences with your customer service team. CSAT is not quantitative, but it offers valuable qualitative insights, helping your agents understand how their knowledge and skills directly affect clients.
Although statistics and metrics help you understand service efficacy, customer support is about people. Numbers can’t define experiences and people. Hence, giving customers a chance to provide qualitative, subjective feedback lets you better understand their experiences.
Measuring CSAT involves asking open-ended questions regarding your customer care procedure and the agent’s performance. Use a Likert scale from 1 through 5, 1 through 10, or very unsatisfied through very satisfied when asking clients to rank their experiences.
2. First Contact Resolution
First contact resolution (FCR) involves tracking how frequently your call center accomplishes a customer ticket or inquiry on their first interaction with a representative. Calculate the score by dividing the number of tickets closed on the first interaction by the total number of contacts.
Keeping tabs on this contact center KPI is important because it indicates how knowledgeable your customer center representatives are about resolving problems. It also tells you whether your standard operating procedure is effective.
FCR precisely shows your contact center’s strengths and weaknesses. For instance, your customer service procedure might encounter problems if you have a low FCR. Improving this KPI requires examining the overall customer service process, from contact center agent onboarding to documentation and procedures.
3. Cost per Contact
The cost per contact is the total operating expenses of your call center. You measure it by dividing your contact center’s overall operating costs by the total number of tickets processed. You refine this KPI by determining the cost of each messaging channel.
Determining your cost per contact narrows down which platforms are most relevant to your clients. Your CPC also indicates which channel performs best and whether your customers prefer phone calls or a combination of live chat and email.
4. Customer Retention Rate
Customer retention rate (CRR) measures the number of clients who maintain their business relationships with you during a given time.
A high CRR typically means your contact center process is practical and helpful. A low CRR means your customer service has room for improvement.
Consider giving clients incentives for each service inquiry to improve your CRR. This helps alleviate stress and frustration for clients, especially when solving a problem takes a long time.
5. Call Abandonment Rate
The call abandonment rate tracks the frequency at which clients disconnect before talking with a customer service agent. This contact center KPI is important because it indicates the effectiveness of your holding strategy. For instance, if you have a high abandonment rate, customer service agents will have a delayed response time.
Determine your call abandonment rate by subtracting the number of answered calls from the total number of calls received and finding the percentage.
Consider simplifying your holding techniques by eliminating complex interactive voice response (IVR) menus to improve your call abandonment rate.
6. First Response Time
First response time (FRT) assesses the average time a customer service representative takes to give an initial response to a client.
Although similar to an average speed of answering, FRT also considers platforms outside of voice calls. It can be a support ticket or a response to a client inquiry via email, text messaging, live chat, or social media.
7. Average Speed of Answering
The average speed of answering (AVA) tracks a customer service agent’s time to respond to a client’s initial contact.
Your ASA evaluates how knowledgeable customer service agents are about your product or service. It also determines whether agents require help such as additional team support or training.
8. Average Wait Time
Average wait time (AWT) is the cumulative time a representative places the caller on hold during an interaction, whether to research the issue’s cause, seek the advice of a supervisor, or finish an interaction with another customer.
This metric contributes to the overall interaction length. It’s a good indicator of whether agents deliver the excellent service that callers deserve.
Calculate your AHT by dividing customers’ cumulative seconds on hold by the total number of calls.
Ideally, you want to reduce your AHT. Reports show that one- to two-minute wait time receives the highest CSAT score—almost 86%. Optimizing AWT means concentrating on other interactive elements that affect resolution, such as average handling time.
9. Average Handling Time
Average handle time (AHT) involves the overall duration of a ticket, from the first interaction, through any waiting periods or holds, to the final resolution. This contact center KPI indicates the effectiveness of your customer support processes and your agents’ knowledge and efficacy.
Find this score by adding the overall time a customer service agent spent helping a client, the total work time after an interaction, and the entire hold time during the interaction. Divide the sum by the total number of tickets.
10. Average Idle Time
Idle time measures the time a representative finishes work related to a customer ticket once the contract ends. This contact center KPI also means after-call work time.
After the interaction, the agent must input relevant notes or information into the contact center database or send printed materials or a follow-up email.
Some contact centers require agents to accomplish these tasks while customers are still on the line. Although this strategy leads to lower idle time, it also creates higher AHT in the process.
11. Agent Attrition Rate
Your agent attrition rate assesses how often customer service agents leave your contact center at a given time. This KPI directly affects the quality of your customer support. Providing comprehensive and consistent customer support is challenging with a high attrition rate.
Find your turnover rate by dividing the number of customer service agents who resign from your center over a given period by the cumulative number of agents in that period. Multiply the quotient by 100 to get the percentage.
12. Service-level Agreement
A service-level agreement (SLA) is a contract between businesses and their clients. This agreement helps evaluate whether the two parties fulfill their pre-agreed responsibilities and scope of work. This contact center KPI measures the availability of agents and relates it to the amount of time clients spend on hold and in queues. Typically, each queue has a separate service-level agreement.
Understanding your SLA lets you step into your client’s shoes and see what daily communication with your customer service is for them.
13. Rate of Absent Agents
This KPI measures the number of absent representatives in a given period. The cumulative days lost per year due to agent absenteeism significantly affect contact center staffing, scheduling, and the company’s bottom line.
A contact center KPI measuring the rate of absent customer service representatives is incredibly helpful when optimizing workforce management processes or revising an existing budget.
Knowing enough representatives are present and scheduled at a particular period is vital for managing high call traffic, reducing queue wait times, and limiting call abandonment rate.
14. Agent Utilization Rate
Agent utilization rate evaluates your workforce’s productivity. Find this score by dividing agents’ total hours worked by the cumulative hours in a workday. Multiply the number by 100 to get the percentage.
For instance, if a representative works for six hours in an eight-hour shift, they have a utilization rate of 75%. Agent utilization rate lets you determine peak workers and those who require extra training or motivation.
Don’t forget to include the time for lunches, breaks, and vacations to obtain an accurate calculation.
15. Call Volume Trends
Call volume trends analyze contact volumes across various intervals compared to your average answering speed. For instance, you might analyze your call volume trends during August weekends or Tuesdays at lunchtime. These trends help identify the specific period when incoming tickets begin to burden agent bandwidth.
Use this KPI to notify hiring and scheduling. For instance, recruit seasonal staff to fill in vacant positions if your call volume tends to spike during the holidays. Conversely, you might need to reschedule fewer agents at night to accommodate high call traffic.
Assigning more representatives during busier hours results in quicker response time, increasing the CSAT score.
16. Peak-hour Traffic
Peak-hour traffic shows the period when your contact center receives the highest volume of tickets.
Determine this KPI by analyzing your call volume trends. Knowing your peak-hour traffic helps you allocate representatives ahead of time to manage higher call volumes.
17. Repeat Calls
Repeat calls represent how often the same client calls to solve an issue. The call might be about a similar problem or a completely new one. Use this contact center KPI in conjunction with FCR to know how well your team and resources resolve customer issues.
If the number of repeat calls is too large, consider refining your self-service option or giving agents more problem-specific training. You might also have to improve your IVR to manage customer tickets without agent interference.
18. Active Waiting Calls
Active waiting calls measure how many customers are in line to reach a customer service representative in real-time. It also measures how well your contact center manages traffic in real-time. This contact center KPI is important because it evaluates your customer service’s effectiveness.
Too many active waiting calls result in slow ASAs. Additionally, excessive contacts waiting for a response lead to poor customer experience, lower retention, and agent burnout. If this rate is constantly high, consider recruiting more representatives, adjusting your AHT, and improving your workflow.
19. Average Call Transfer Rate
The average call transfer rate is a metric that measures how frequently agents pass a call to a colleague, a manager, a supervisor, or a different department. Divide the overall number of contacts managed by the total number of calls transferred to arrive at this rate.
Understanding your average call rransfer rate is vital for assessing the customer experience. For example, customers may experience frustration when they are repeatedly transferred from one agent to another. A study by Zendesk highlights that 68% of callers feel irritated when they go through multiple department transfers.
To enhance both this KPI and the overall customer experience, consider introducing extensive training that spans across various departments. This will enable agents to handle a wider range of queries, thereby reducing the necessity for call transfers.
20. Percentage of Calls Blocked
Another contact center metric that significantly influences client success is the percentage of calls blocked. This KPI measures the number of inbound calls that get a busy tone for the following reasons:
- There are no available agents
- Queues are at maximum capacity
- The contact center platform is unable to manage the ticket volume
Each call blocked is a missed opportunity to interact with clients, deliver an excellent customer experience, and strengthen loyalty. Thus, you should not ignore this performance indicator.
21. Callback Requests
Callback requests track the frequency with which customers request to be called back rather than waiting on hold. Requesting a callback lets customers receive a faster resolution for their issues without increasing their frustration.
If your callback requests are too high, you might not have sufficient workers or bandwidth to accommodate inbound calls. Consider improving your efficiency or hiring more representatives to reduce your callback requests and take more calls as you receive them.
22. Call-Type Mix
The call type mix identifies the volume of different contact varieties and intentions. Call types include:
- Upgrades
- Billing assistance
- Technical support
- Issues or complaints
- Applications
- Account help
Use this insight to deliver better customer self-service options or improved employee training. Consider using it to create better IVR tree menus to connect callers to the appropriate extension. Enhancing your IVR helps reduce your call transfer rate and improves FCR.
23. Channel Mix
Channel mix tracks the number of incoming contacts on various channels such as phone calls, live chat, or social media. This contact center KPI lets you see which platform your clients prefer, allowing you to invest in the appropriate tools, resources, and agents.
For example, consider training more customer service agents on managing social media tickets if the number of customers using the channel is growing.
24. Custom Metrics
Custom metrics provide the flexibility to establish unique Key Performance Indicators (KPIs) tailored to your organization’s specific priorities and goals. This approach ensures that your evaluation criteria are not confined solely to standard industry metrics.
Are you interested in comparing the level of satisfaction between phone calls and email responses? You can assess and juxtapose these two aspects. If you’re curious about the satisfaction levels of your agents, you can design and implement a survey specifically to gauge this.
Various contact center software solutions offer the capability to create bespoke KPIs for monitoring agent performance, as well as the addition of queue widgets.
For example, you can devise a specific metric if you aim to track the number of successful calls within your queue (such as calls that entered the queue and weren’t abandoned). This can be done by calculating the difference between the total number of calls that entered the queue and those that were abandoned.
25. Phone Etiquette
Scoring the quality of an agent’s etiquette during an interaction is important. This KPI involves several factors that quality assurance listens to or quality management reviews on the call.
An agent’s score depends on the factors ticked off. Good phone etiquette includes greeting the caller by name, repeating the customer’s problem for both parties’ better understanding, and using a clear, calm tone.
26. Adherence to Procedures
In most contact centers, agents must follow a standard script while conversing with customers. With contact center KPIs, managers track and determine:
- How well do representatives follow organizational procedures while interacting with clients
- How agents greet callers
- How to best terminate a call
- When a transfer is most appropriate
- How to de-escalate a heated situation
Monitoring agents’ adherence to procedures helps guarantee consistency in your contact center’s customer service.
The Bottom Line

Contact center KPIs evaluate the overall customer service team. Important performance indicators to track include average call abandonment rate, average handle time, first contact resolution, and average time in queue.
Tracking contact center KPIs provides valuable insights into agent effectiveness, team productivity, and customer service success. KPIs help companies identify the best ways to use training and technology to help customer service agents become successful and reduce attrition. The key to effective KPIs is keeping them focused on specific, measurable factors.
Are you looking to boost your contact center’s performance? Unity Communications is here to help. Improve your customer service strategy and exceed customer experience expectations using Unity Communications CCaaS. Get in touch with us now.


