IN THIS ARTICLE
Table of Contents
Technological advancements, shifting consumer behaviors, and the growing role of data drive digital marketing’s evolution. Much of the content in 2026 will be AI-generated, reshaping content marketing and advertising. Data analytics will improve targeting, engagement, and return on investment (ROI).
How about this year? This article provides a comprehensive list of digital marketing statistics for 2025. Read below to learn more about optimizing and scaling campaigns, enhancing the customer experience, and making strategic decisions.
Overview of the global digital marketing industry
The digital marketing industry is massive and competitive. But how huge is it? What are the current profitable markets, and how fast did it grow compared to 2024? The following statistics provide the answer.
Market size and growth
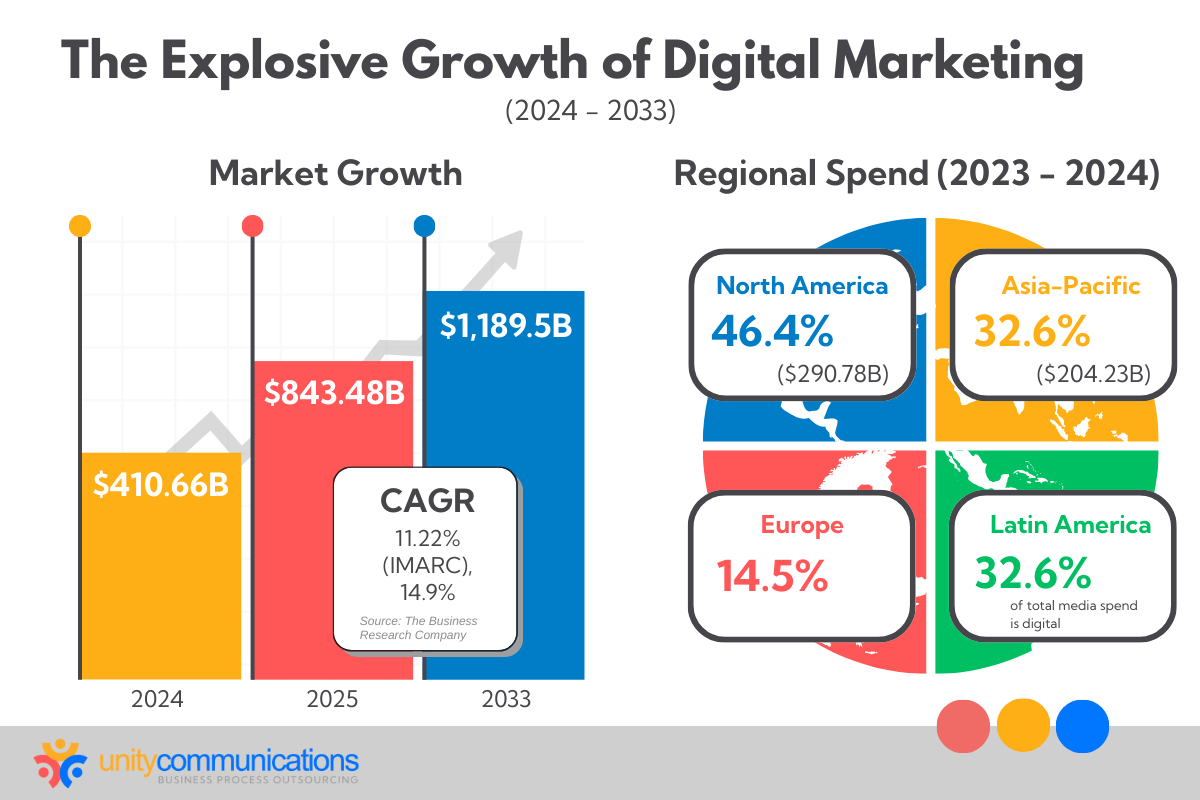
The digital advertising market is expanding quickly. It could increase from $734.24 billion in 2024 to $843.48 billion in 2025 at a compound annual growth rate (CAGR) of 14.9%. Higher ad spending, e-commerce expansion, smartphone accessibility, and increased social media use drive the growth.
Learn more about the digital marketing industry from more statistics below:
- In 2024, the industry’s market size was worth about $410.66 billion and is projected to grow to $1,189.5 billion by 2033 at 11.22% CAGR. (imarc)
- The digital marketing market was valued at $322.2 billion in 2022, with projections of reaching $689.8 billion by 2028 at a 13.62% CAGR. (Global Newswire)
- Fueled by increasing internet use and online content demand, digital advertising remains essential in global marketing. Spending might have reached $694 billion in 2024, accounting for 70% of total ad investments. (Statista)
- Google dominates digital ad revenue, which could hit $340 billion by 2027 (40% of total sales), followed by Facebook at $127 billion. Along with Amazon, Apple, TikTok, and Twitter, these “walled gardens” control ad data and activities, strengthening their influence as third-party cookies end. (Statista)
Regional Insights
Digital ad spending varies by region:
- North America led with $290.78 billion in 2023, making up 46.4% of global expenditure.
- Asia-Pacific followed with $204.23 billion (32.6%).
- Europe contributed 14.5% of the total.
- Latin America saw digital ads comprise 54% of total media spending in 2024. (Statista)
Search engine optimization (SEO) Statistics
Understanding SEO is a crucial marketing strategy for beginners. It continues to drive online visibility, with search rankings directly influencing website traffic and engagement. However, artificial intelligence (AI) integration, zero-click searches, and user experience optimization are reshaping strategies as search algorithms evolve.
To stay competitive, you must adapt to these trends, prioritizing high-quality content and technical SEO.
Search engine usage
As of January 2025, global search engine market shares are:
- Google: 91.47%
- Bing: 3.43%
- Yandex: 1.78%
- Yahoo: 1.10%
Google’s share briefly fell below 90% in late 2024, signaling a market shift. (Search Engine Land)
As of February 2025, the U.S. search engine market distribution is as follows:
- Google: 87.31%
- Bing: 7.46%
- Yahoo: 2.65%
- DuckDuckGo: 2.07%
These statistics emphasize Google’s dominant position, with Bing, Yandex, and Yahoo maintaining smaller shares in both global and U.S. markets. (StatCounter)
Organic search performance
Organic search remains a critical component of digital marketing for startups and established organizations alike. Key statistics include:
- Clickthrough rate (CTR). The average organic CTR is 2%, although it varies by industry and channel. A 2% to 5% CTR is typical for emails, while search ads perform well at 6% to 7%. (Keyword.com)
- Evolving search trends. Most Google searches in the U.S. (58.5%) and EU (59.7%) end in zero clicks. Users either refine their questions or leave without clicking a result. (Search Engine Land)
Prioritize SEO efforts to reach high-ranking positions, engage users, and adapt to changing search behaviors.
Pay-per-click (PPC) advertising statistics
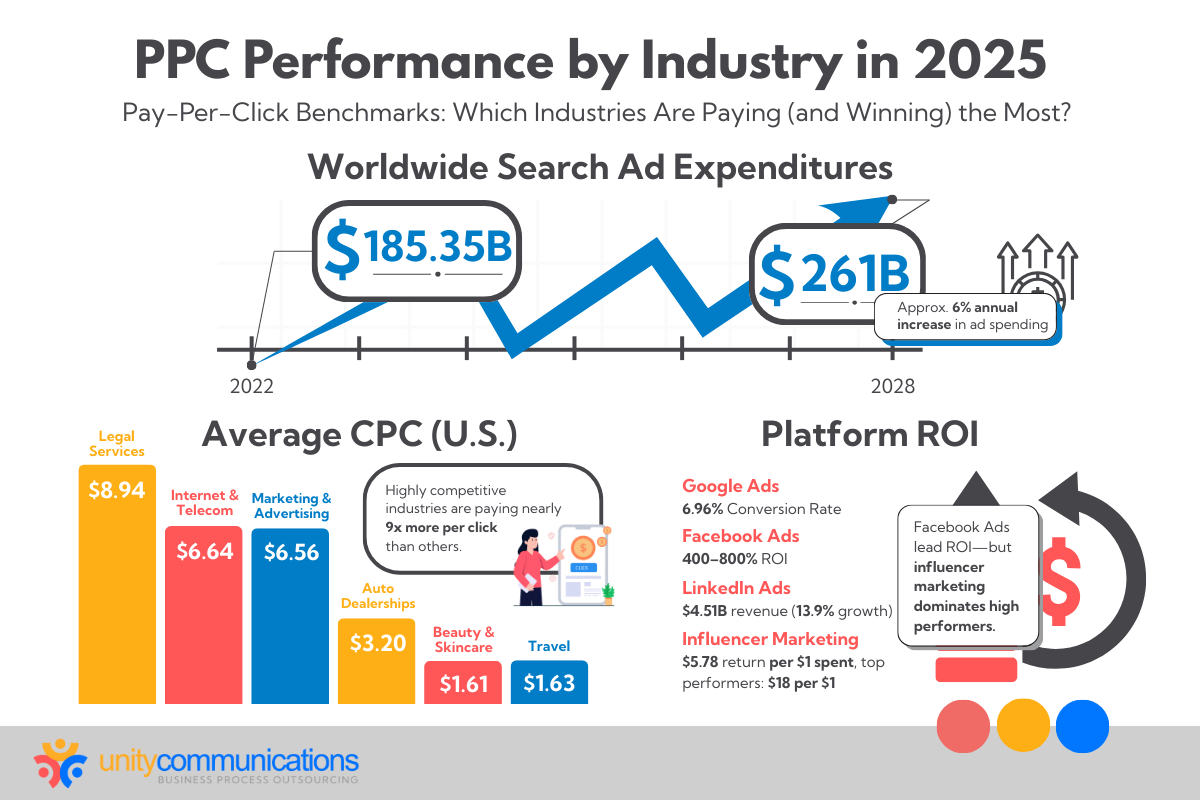
PPC advertising remains influential in digital marketing, although trends in budget allocation, platform effectiveness, and cost-per-click variations have changed.
As competition grows, use the following digital marketing statistics to refine targeting strategies, optimize ad spending, and automate PPC to maximize returns.
Investment and returns
As of 2024, PPC advertising generates different ROIs across different platforms:
- Google Ads. The average conversion rate is 6.96%. About seven of every 100 ad clicks result in a desired action, such as a purchase or sign-up. (Wordstream)
- Facebook Ads. It could deliver a 400% to 800% ROI. (Save My Leads)
- LinkedIn Ads. U.S. ad revenue is expected to grow 13.9%, reaching $4.51 billion this year. (EMarketer)
- Influencer marketing. In 2024, 60% of marketers planned to increase influencer marketing budgets. On average, businesses earn $5.78 per dollar spent. Best performers generate $18 per dollar. (Digital Marketing Institute)
Budget allocation
As of December 2024, PPC advertising expenditures and average cost-per-click (CPC) rates significantly vary across industries:
Industry-specific average CPCs in the United States
- Attorneys and legal services: $8.94 (Statista)
- Internet and telecommunications: $6.64 (Statista)
- Marketing and advertising: $6.56 (Statista)
- Automobile dealerships: $3.20 (Statista)
- Beauty and skincare: $1.61 (Statista)
- Travel: $1.63 (Statista)
These PPC costs reflect intensifying competition across industries and increased consumer demand.
Global advertising spending trends
- Global advertising and marketing spending maintains an upward trend from $1.78 trillion in 2024 to $1.87 trillion in 2025. (Statista)
Search advertising expenditure
- Search ad spending grows steadily from $185.35 billion in 2022 to $196.66 billion in 2024. (Statista)
Understanding industry benchmarks helps you stay competitive in an increasingly dynamic paid search landscape.
Social media marketing statistics
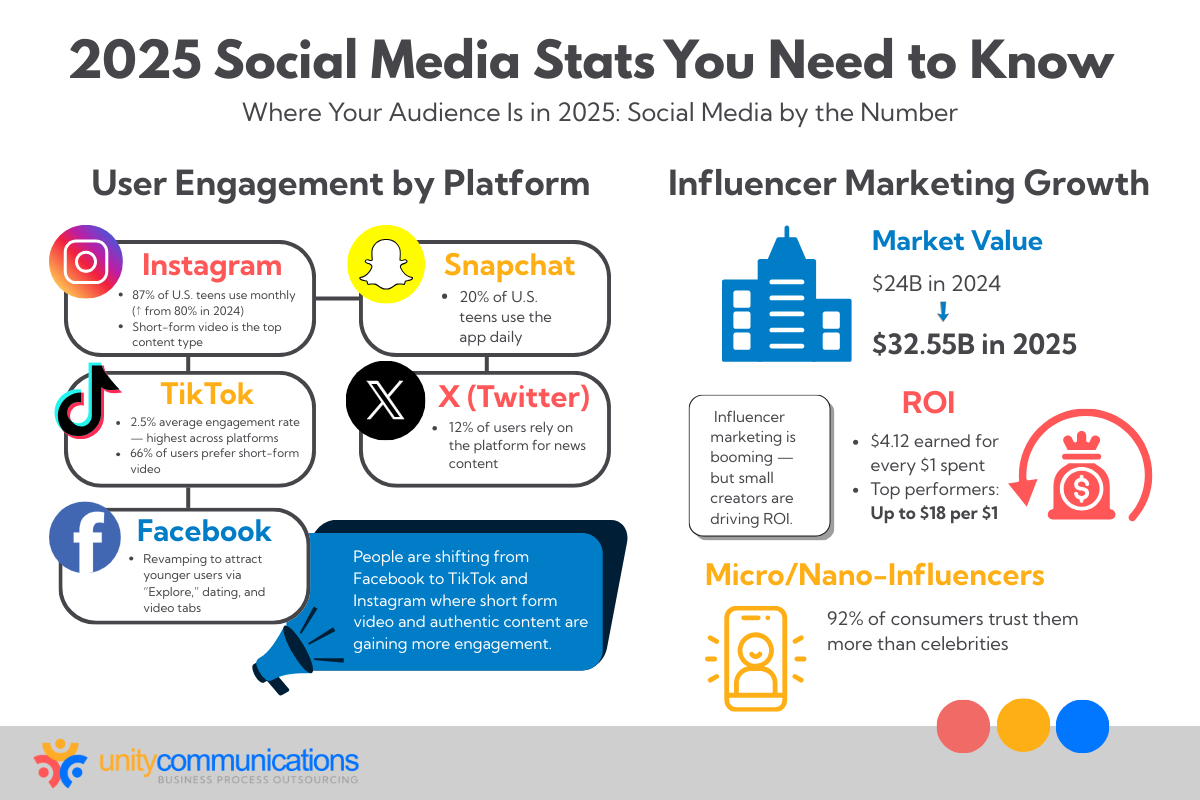
In 2025, social media marketing, especially for niche industries, will thrive. Visual-based apps such as Instagram and Pinterest will expand quickly as the demand for eye-catching content increases. Short-form videos will dominate, driving more engagement.
Your brand should prioritize compelling visual and video content to stay relevant on social media.
Platform popularity and user engagement
As of 2025, social media platforms exhibit diverse user demographics and engagement levels:
- Facebook attracts younger users through “Local” and “Explore” tabs, video content, and dating services. (Reuters)
- Instagram is popular among U.S. teens, with 87% using the app monthly. This increased from 80% in 2024. (Threads)
- TikTok remains highly engaging (2.5%), especially among younger audiences. (Social Insider)
- X (formerly Twitter) has 12% of users regularly accessing news content on the platform. (Pew Research)
- Snapchat is used by 20% of U.S. teens daily. (Grove Estate)
Understanding these demographics and engagement metrics can help tailor social media strategies.
Influencer marketing
Influencer marketing continues to significantly enhance brand reach, sales, and engagement in 2024 and 2025:
- ROI. Brands earn about $4.12 for every dollar spent. (Dash)
- Market growth. The industry could expand from $24 billion in 2024 to $32.55 billion by 2025, reflecting its growing impact on brand strategies. (Sprout Social)
- Consumer purchasing behavior. Influencer content motivates 49% of consumers to buy at least once a month, proving how collaborations drive sales. (Sprout Social)
- Content repurposing. Most brands (63%) repurpose influencer-generated content on their social media channels to maximize engagement and reinforce brand messaging. (Adam Connell)
- Micro and nano-influencers. About 92% of consumers trust them over ads or celebrities due to their authentic content and close audience connections. (Heylist)
These trends show how influencer collaborations boost brand visibility, sales, and consumer engagement.
Mobile marketing statistics
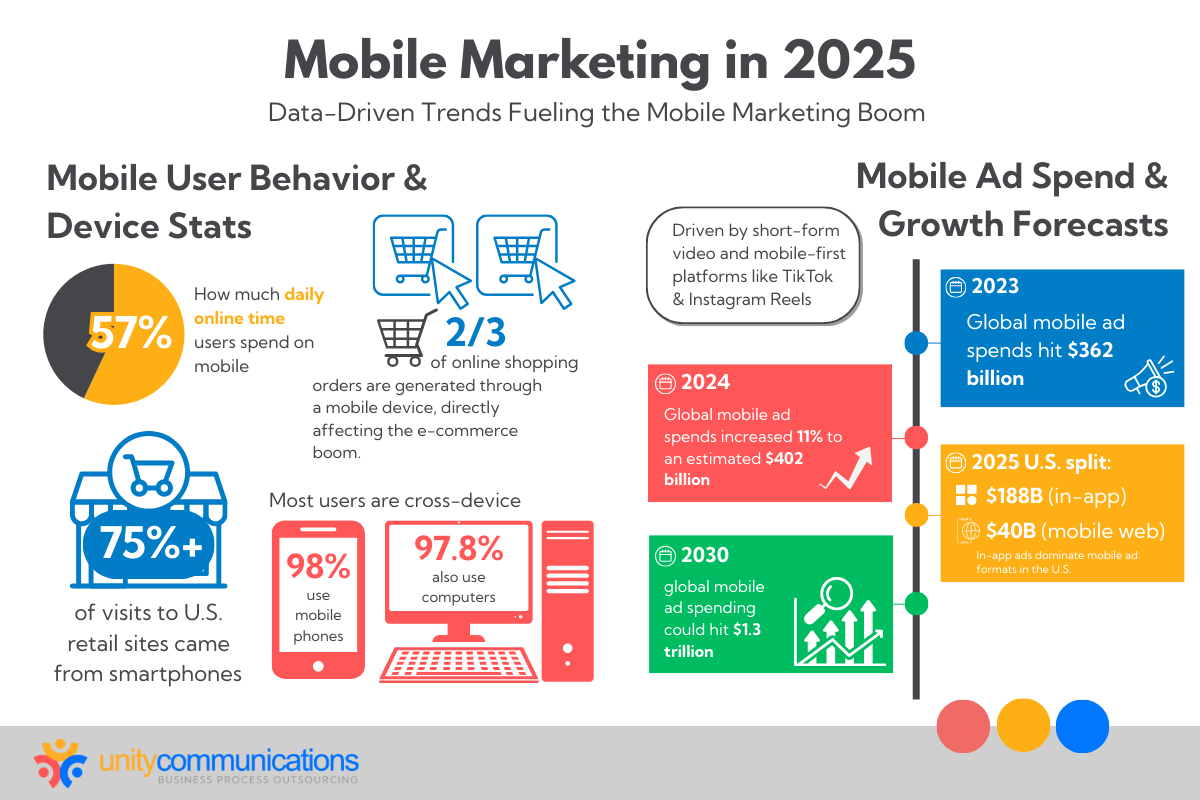
In 2025, mobile marketing will grow as advertising spending and global smartphone users increase. The following digital marketing statistics highlight the need for mobile optimization.
User behavior and preferences
By late 2024, most people used mobile devices to access information, connect online, and shop. This shift reflects changing user habits and the growing reliance on mobile technology for everyday activities.
- Global website traffic. In the last quarter of 2024, mobile devices (excluding tablets) captured 62.54% of global website traffic. (Statista)
- Daily online time. Internet users spent nearly 57% of their daily time on mobile devices in the third quarter of 2024. (Statista)
- Internet access by device. About 98% of global users accessed the internet via mobile phones, while 97.8% used their computers in Q3 2024. This indicates a significant overlap in device usage. (Statista)
- U.S. retail site visits. Smartphones accounted for over 75% of retail site visits in the United States during Q3 2024, generating around two-thirds of online shopping orders. (Statista)
Mobile advertising
Short-form videos, in-app ads, and programmatic advertising dominate mobile advertising, while digital channels lead global ad investments. In the U.S., in-app ads will drive most of the projected mobile spending by 2025.
- Market size. Data.ai shares that global mobile ad spending grew 8% to $362 billion in 2023 due to short-form video and video-sharing apps. It could have increased by 11% or $402 billion in 2024. (Marketing Dive)
- Platform breakdown in the U.S. By 2025, mobile advertising spending in the United States could total $228 billion. In-app advertising will account for $188 billion, and mobile web advertising for $40 billion. (Statista)
- Global ad investment. Digital channels now represent 72.7% of worldwide ad investment, with online spending surpassing $790 billion in 2024. (Data Reportal)
- Projected growth. The mobile advertising market could reach $1.3 trillion by 2030 due to the rise of smartphones and programmatic advertising. (Global Newswire)
Content marketing statistics
Content marketing remains a crucial digital strategy, driving brand awareness, engagement, and conversions. Marketers are increasing their investment in high-quality, targeted content, but challenges such as measuring ROI and adapting to algorithm changes persist.
Adoption and effectiveness
In 2024, content marketing grew as more businesses increased investment and adoption. With fewer production challenges, businesses created and shared content more effectively.
- Content marketing is becoming more popular and effective. In 2024, half of marketers planned to invest more. (OptinMonster)
- About 82% of marketers actively invest in content marketing, indicating its business value. (Ahrefs)
- Content production issues dropped to 12.9% in 2024. (Adam Connell)
Challenges
In 2024, marketers faced several key challenges in content creation and distribution:
- Measuring ROI. Over half (56%) of business-to-business (B2B) marketers cannot determine content ROI (Content Marketing Institute), while 41% still measure it through sales (HubSpot). These numbers underscore the need for clear ROI metrics.
- Tracking customer journeys. Another 56% cannot see how content affects buyer decisions. (Content Marketing Institute)
- Adapting to digital marketing changes. About 22% of marketers worry about content visibility as search and social media rules shift. (Adam Connell)
Use these statistics to balance digital versus traditional marketing and create impactful, measurable, data-driven content.
Email marketing statistics
AI-driven automation and personalization make email marketing campaigns more targeted and impactful. The following digital marketing statistics reveal more about the strategy’s growth.
ROI and effectiveness
Email remains essential despite the rise of chat apps, with users growing from 4.37 billion in 2023 to a projected 4.89 billion by 2027. (Statista)
- High ROI. Email marketing generates about $36 for every $1 invested. (Shopify)
- Increased revenue. Over half (52%) of email marketers saw their ROI double from 2022 to 2023, while another 5.7% reported a fourfold increase. (Shopify)
Conversion rates
- Clickthrough rate (CTR). As of January 2024, the average clickthrough rate is 1.4%. (Smart Insights)
- Open rates. As of August 2024, the average open rate across all industries was 32.55%, reflecting robust engagement levels. (Constant Contact)
Automation and personalization
- AI-driven automation and personalization have greatly improved email marketing. It boosts revenue by 41% and clickthrough rates by 13.44%. (G2)
- About 89% of marketers consider personalization crucial to success in the next three years. (Exploding Topics)
As competition for inbox attention grows, your business must leverage data-driven insights and innovative tactics to maximize email marketing effectiveness and improve customer engagement.
Video marketing statistics
More businesses create videos to grow brand awareness and engagement. Meanwhile, TikTok and Instagram Reels increased the engagement rate of short-form videos, emphasizing consumers’ preference for concise, impactful content.
Learn more about the popularity of this strategy in the following digital marketing statistics:
Adoption and effectiveness
- Global digital video ad spending could hit $207.52 billion by 2025. (Statista)
- By 2025, U.S. digital video ad spending is expected to be near $92 billion, highlighting its ability to engage consumers. (Statista)
- About 67% of global marketers will use Instagram for video content. (Statista)
Consumer engagement
- Short-form videos have the best engagement. Its average watch time is 60 seconds of a minute (27% of the entire video), higher than 16 minutes of a 1-hour video. (Dash)
- About 30% of short-form videos have an average watch rate of over 81%. (Firework)
- Around 66% of consumers consider short-form videos more engaging on social media than longer ones. (Yaguara)
In your video marketing plan, align the visual content with consumer preferences. For example, short-form videos can quickly engage younger generations and those with shorter attention spans.
Either way, producing compelling, high-impact videos can boost brand visibility and conversion rate and strengthen audience connection in 2025 and beyond.
Conversion rate optimization (CRO) statistics

CRO increases the percentage of visitors who complete desired actions. Although industry conversion rates vary, top-performing websites achieve significantly higher numbers.
Importance and focus
- In 2024, the average global website conversion rate is 2.35%, while top sites exceed 11%. These numbers highlight opportunities for optimization. (Clever Tap)
- In Q4 2024, e-commerce conversion rates were highest in food and beverage (3.1%), followed by beauty and skincare (3%). The overall average across sectors was just over 2%. (Statista)
Landing page performance
- Landing page conversion rates vary across industries, reflecting the importance of tailored strategies. Unbounce revealed that the median conversion rate for all industries is 4.3% after examining 44,000 landing pages and 33 million conversions. (Unbounce)
Optimize your conversion funnels to guide potential customers seamlessly toward desired actions and boost conversion rates and profitability. Implement best practices such as improving user experience, optimizing landing pages, and conducting A/B testing.
Artificial intelligence in marketing
Businesses use AI to enhance personalization, task automation, and analytics optimization. The technology also improves customer experiences, streamlines operations, and boosts campaign effectiveness.
Adoption and applications
- In 2022, the market value of AI in marketing hit $12.35 billion. By 2032, it would reach $93.98 billion at 22.5% CAGR as businesses increasingly adopt AI to enhance efficiency and personalization. (Spherical Insights)
- The global AI marketing industry could have generated around $36 billion in revenue in 2024. (Statista)
- A mid-2024 survey found that about 11% of marketing professionals globally heavily utilize AI in data-driven marketing. (Statista)
- In 2024, almost one-third of U.S. B2B marketers tested AI-driven personalization. (Statista)
Impact on performance
- Personalization. Around 88% of marketers using AI reported it improved cross-channel customer journey personalization, consistent with the previous year. (Statista)
- Automation. Within the next three years, 78% of marketers plan to automate over a quarter of their tasks using AI. (Planable)
- Analytics. The global AI in data analytics market could grow from $18.5 billion in 2023 to about $236.1 billion by 2033, with a 29% CAGR from 2024 to 2033. (Market.us)
You must adapt to AI to stay competitive. Leverage data-driven insights to develop more targeted and efficient strategies.
Influencer and user-generated content (UGC) marketing
Influencer and UGC marketing fosters authenticity and trust. Consumers increasingly rely on actual experiences and peer recommendations when deciding on purchases.
Impact and effectiveness
UGC shapes consumer purchasing decisions:
- Influence on trust and decisions. Around 82% of consumers are more likely to purchase from a brand with UGC marketing. (Keywords Everywhere)
- Perceived authenticity. About 90% of consumers consider authenticity essential when choosing brands to support. (Wisernotify)
- Engagement and conversion. Websites with UGC content convert 29% higher than those without, demonstrating its impact on consumer engagement and sales. (Influee)
Brand authenticity
UGC enhances brand authenticity and affects consumer trust and engagement:
- Perceived authenticity. UGC influences 79% of customers, including 84% of millennials, in buying decisions. (UGC101)
- Trust and purchase decisions. Around 48% of consumers see UGC as valuable for discovering new products. (Xperiencify)
- Engagement. An impressive 91% of active Instagram users watch reels daily, boosting engagement with UGC. (Wisernotify)
As brands prioritize credibility and engagement, influencer partnerships and organic customer content have become essential for staying competitive online and offline.
Emerging trends and future projections
The marketing industry is rapidly evolving, with AI, video content, and UGC driving engagement and conversions. AI-powered automation and personalization reshape strategies, while short-form videos dominate digital platforms. UGC continues to build consumer trust and influence purchasing decisions.
These trends indicate a shift toward more interactive, data-driven, and authentic marketing approaches, urging brands to adapt for continuous success.
Market growth
- The digital marketing industry is expanding quickly, with global ad spending expected to exceed $1 trillion by 2025. (EMARKETER)
- In the United States, digital ad spending could surpass $300 billion in 2024, a 15.1% increase from the previous year. (EMARKETER)
- Retail media, connected TV (CTV), and social media could grow twofold. (iab.com)
Technological advancements
AI, voice search, and blockchain redefine digital marketing:
Artificial intelligence (AI)
- Integration in marketing. By 2025, 30% of outbound marketing messages from large companies will be AI-generated. (Gartner)
- Generative AI in retail. The retail industry will expand its use of generative AI in 2025, integrating the technology into core operations. (Retail Touchpoints)
Voice search
- Worldwide adoption. About 20.5% of the global population uses voice search, a slight increase from 20.3% in early 2024. (Yaguara.co)
- Proliferation of voice assistants. AI-powered voice assistants could have exceeded 8.4 billion worldwide by the end of 2024, outnumbering the global population. (Planable)
- Conversational search patterns. By 2026, conversational AI in contact centers will cut agent labor costs by $80 billion. (Gartner)
Blockchain
- Market size. The blockchain market is set to reach $1,235.71 billion by 2030 at a 28.1% CAGR from 2024. (IndustryARC)
- Security. Blockchain 4.0’s focus on speed, innovation, and usability could reduce ad fraud, secure data, and boost revenue for blogs and news sites hosting ads. (Business.com)
- Data privacy. Blockchain’s built-in security features reduce fraud and data breaches by 30%. As data privacy in digital marketing concerns rise, the technology securely manages consumer data and strengthens trust between brands and customers. (Digital Experience Live)
More digital marketing stats
Employee-generated content (EGC)
EGC enhances authenticity, boosts engagement rates, and builds consumer trust. Recent data reveal its significant impact on digital marketing:
- Enhanced engagement. In 2023, 1,903 employees shared 11,107 LinkedIn posts, averaging 5.83 posts each. An analysis found that EGC about company culture outperformed other content types in engagement. (DSMN)
- Increased reach. EGC outperforms official brand accounts in reach and engagement on social media platforms. (Forbes)
- Cost-effective authenticity. With increasing influencer costs and tighter marketing spending, brands now prioritize UGC and EGC to remain authentic while running more budget-friendly campaigns. (Forbes)
AI’s role in the beauty and retail industry
AI transforms beauty and retail industries by further personalizing shopping experiences and optimizing digital advertising strategies. Recent statistics from 2024 and 2025 illustrate its impact:
AI-powered recommendations and personalized shopping experiences
- Market growth. The market for AI-powered personalized recommendations is expected to expand from $1.84 billion in 2024 to $24.8 billion by 2034 at a 29.7% CAGR. (Market.us)
- Consumer expectations. In the beauty industry, 58% of consumers purchase from brands that suggest products through online quizzes. (Nosto)
- Enhanced engagement. Sephora reports that its Virtual Artist tool has boosted conversion rates by 11% and lowered product returns by 30%, showcasing AI’s role in enhancing the shopping experience. (Echwa)
Predicted impact on digital ad targeting and conversion rates
- Improved conversion rates. AI could increase an email’s performance by 82%, emphasizing how the technology connects emails better to consumers through personalization. (Bizplanr)
- Revenue growth. About 87% of those surveyed stated that AI has positively influenced their annual revenue. (Nvidia)
These digital marketing statistics underscore AI’s pivotal role in revolutionizing the beauty and retail sectors through personalized experiences and brand interactions.
Evolution of digital ad monopolies
Google, Meta, Amazon, and other large tech companies lead the digital marketing industry.
Market dominance of Big Tech
- Revenue concentration. By 2025, Alphabet-owned Google and YouTube could surpass $200 billion in global digital ad revenue, making them the first advertising platform to achieve this milestone. (EMARKETER)
- Industry share. For the first time, the advertising industry could exceed $1 trillion in revenue. Major players such as Amazon, Alphabet, Meta, Alibaba, and ByteDance lead the growth. (Investors.com)
Impact on ad pricing and accessibility for smaller businesses
Google’s share is shrinking as rivals such as Meta and Amazon expand. While its ad tools help small businesses grow, the Department of Justice claims Google unfairly dominates the market (although similar models exist elsewhere).
Breaking up Google could raise costs, making advertising harder for small businesses and publishers. Without its reach and efficiency, many would struggle to survive. The move could disrupt the digital ad industry and harm small players. (Adexchanger)
The bottom line
Innovation, data-driven strategies, and evolving consumer behaviors will define the digital marketing industry in 2025. Staying ahead requires adaptability, emerging technologies, and better engagement tactics. Simplify the process by knowing what BPO is.
Let’s connect to learn how outsourcing works in reducing costs, enhancing productivity, and growing your business this year.

